


What studying for Tableau Next taught me about nonprofit data

Nonprofits get more from Tableau Next when their data is modeled and governed well, and studying for the Salesforce Certified Tableau Next Consultant exam made that clear to me.
I recently took the Salesforce Certified Tableau Next Consultant exam. I signed up because our nonprofit clients have started asking about Tableau Next, and I wanted to understand it well enough to give them a straight answer. We also purchased and implemented it at Fíonta, so this post draws on our own rollout and the exam.
Preparing for the exam meant spending real time with the product, and I came away convinced it matters for nonprofits. Tableau Next licenses are included with Nonprofit Cloud (NPC), so organizations already on the platform can start exploring it today, and those weighing a move to NPC gain one more benefit to factor into the decision. That’s what most of this post is about: what Tableau Next is, why it fits the problems nonprofits deal with every day, and where I’d start. There’s a short note on the exam at the end for anyone thinking about taking it.
Tableau Next is analytics built inside Salesforce
If you’ve used classic Tableau, Tableau Next will feel familiar in places and very different in others. It runs natively on the Salesforce platform, uses Data 360 (formerly Data Cloud) as its data layer, and puts an AI agent at the center of how people ask questions.
The pieces that matter most:
- Data 360. Data from Salesforce and other systems lands here, gets cleaned up, and is mapped to a common model. If your donor data, event data, and program data live in three places, this is where they meet.
- Tableau Semantics. This is the semantic layer, which is a fancy way of saying “the place where you define what things mean.” What counts as an active donor? Is revenue gross or net? You define it once, and every dashboard and every agent answer uses that definition.
- Visualizations and dashboards. Built in workspaces and embeddable on Lightning pages, in Slack, or on outside websites. Dashboards can include action buttons that launch a Flow or open a record, so people can act on what they see.
- The Analytics Agent. Users ask questions in plain language and get answers grounded in the semantic model. It shows which fields and filters it used, so people can check its work. A related feature watches the metrics you follow and alerts you when something changes.
Fair warning, the names keep changing. In a few months, features I’d learned as Concierge, Data Pro, and Inspector were renamed, and Data Cloud became Data 360. If you’re reading the docs, expect to translate a little.
We bought it and rolled it out ourselves
Before recommending Tableau Next to clients, we purchased and implemented it at Fíonta. We wanted to walk the walk. Owning the licenses, doing the setup, and getting our own team to use it was the fastest way to learn what a client will run into.
Today I use it every week. Our key delivery metrics live there, along with revenue tracking and sales metrics, so delivery and the business side of the house work from the same numbers. More recently, I’ve started connecting Claude to Tableau Next through its MCP server. When I ask Claude a question about our delivery or pipeline, it works from the same definitions our dashboards use instead of guessing what we mean.
A few things from our rollout that I’d pass along to any organization:
- Setup starts in Data 360. Tableau Next sits on top of it, so data streams, mappings, and Data 360 permissions come first. Budget time for that before anyone sees a dashboard.
- Access has layers. Each user needs a Tableau Next permission set and a Data 360 permission set, and every asset has its own sharing. Decide who should see what before you invite people in.
- The semantic model deserves the most time. Agreed definitions and clear field descriptions are what make dashboards consistent and the agent’s answers trustworthy.
- Shared definitions pay off beyond dashboards. Once utilization, bookings, and pipeline were defined in the semantic model, every tool that reads it, including outside AI assistants through the MCP server, gives the same answer.
Being our own first customer means that when we describe an implementation to a client, we’re describing something we’ve been through ourselves, rough edges included.
Why I think it’s a game changer for nonprofits
Most of the nonprofits we work with have the same analytics problem. The data exists, but getting an answer means asking the one person who knows how to build a report, then waiting. Tableau Next goes after that problem in a few ways.
Our metrics map closely to a nonprofit’s
The way we use Tableau Next at Fíonta lines up with what nonprofits need more than you might expect.
Revenue tracking maps to fundraising. We track bookings against plan, pipeline by stage, and revenue scheduled to land each month. A development team asks the same kinds of questions. Are we on pace for our annual fund goal? Which major gift asks are in the pipeline, and how likely are they to close? How much should we expect from recurring gifts and pledge payments this quarter? Both come down to a goal, a pipeline, and money arriving over time.
Delivery metrics map to program management. We watch utilization, project health, and whether work is landing on budget. A program director watches how many people were served, whether programs are hitting their outcome targets, and whether staff capacity matches demand. In both cases, the value is spotting a problem while there’s still time to act on it.
For us, the dashboards were the easy part. The real work was agreeing on what “on pace” or “on budget” means, and a nonprofit will do the same work for “retained donor” or “client served.”
Everyone agrees on what a number means
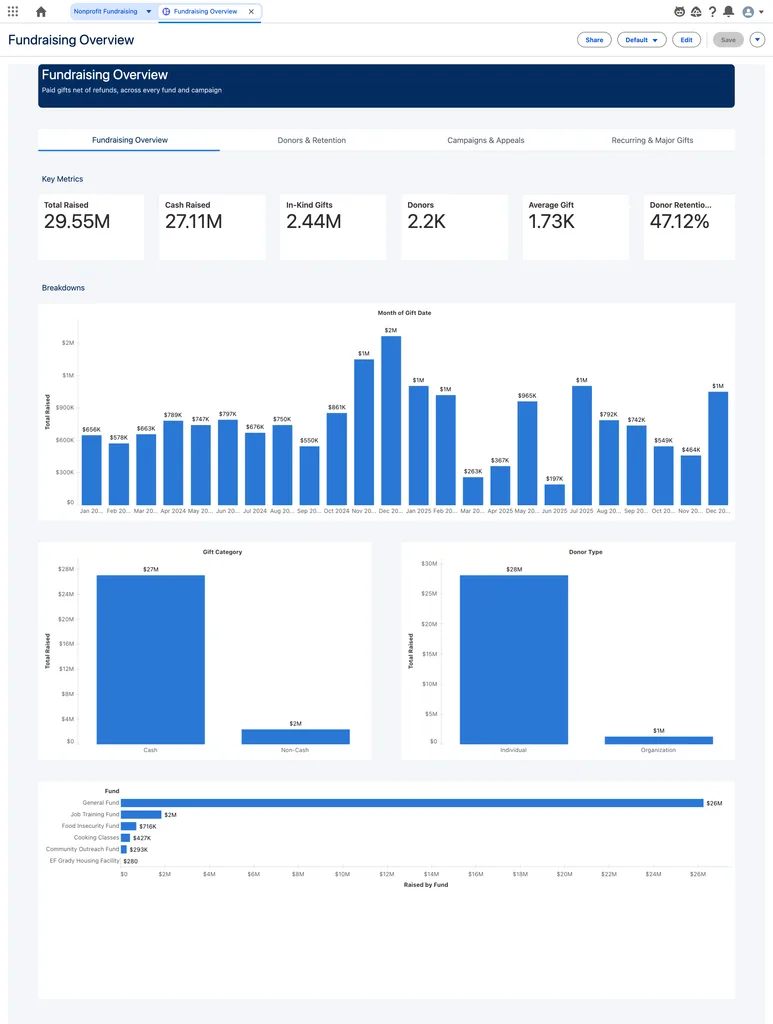
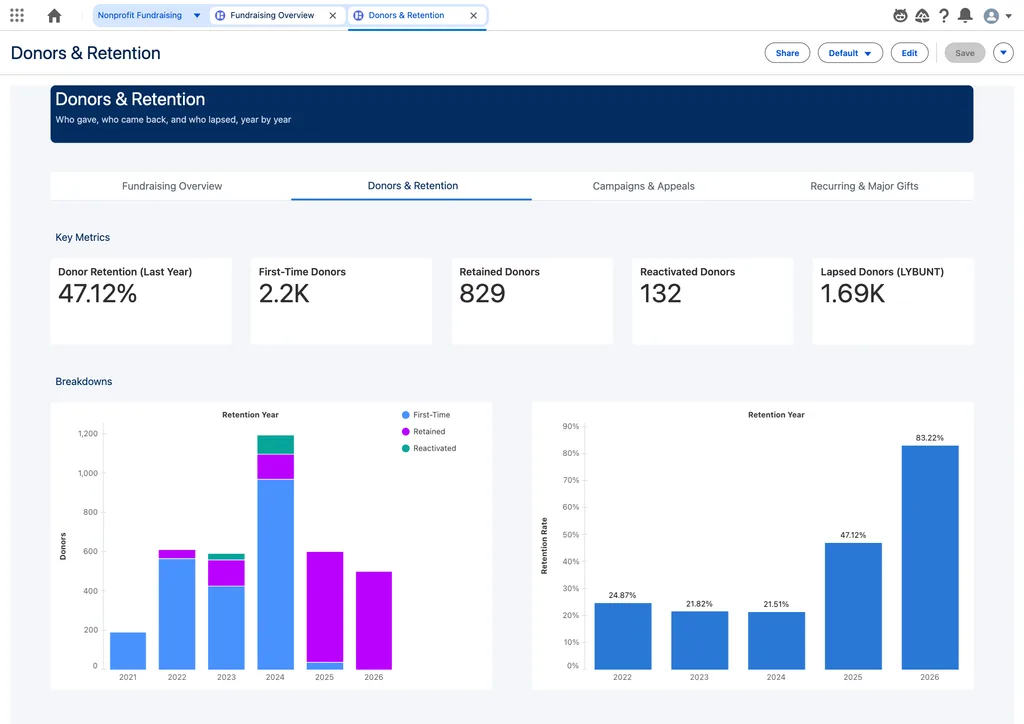
Ask five people at a nonprofit what “retained donor” means, and you’ll get at least three answers. Development counts one way, finance counts another, and the board deck uses whatever was in last year’s board deck. The semantic layer lets you settle the definition once and have every dashboard and every agent answer use it.
That said, the tool won’t settle the argument for you. Someone still has to get development and finance in a room to agree. Once they do, Tableau Next makes the agreement stick.
Program staff can ask their own questions
Most nonprofits don’t have a data team. They have a database manager who’s also the CRM admin, the report builder, and the person who fixes the printer. Letting a program director type “How many families did we serve in Q3 compared to last year?” and get a trustworthy answer takes real pressure off that person.
The agent is only as good as the model behind it, though. Clear field names, descriptions, and business definitions are what make its answers trustworthy, and that setup takes real time. Plan for it.
Insights show up where people already work
A gift officer shouldn’t have to leave a donor’s record to see their giving trend. With Tableau Next, that dashboard can sit on the Contact page, filtered to that donor. Alerts can land in Slack when a key metric moves, like a dip in recurring gifts. Dashboard buttons can launch a Flow, so the officer can log a follow-up task without switching screens.
It’s tempting to embed dashboards everywhere. I’d pick the two or three places where a number changes what someone does next, and start there.
Data from every system finally lives together
Fundraising data is in Salesforce. Email engagement is in the marketing platform. Event registrations are in a third tool, and program outcomes might be in a spreadsheet. Data 360 is built to bring those together, and Tableau Next sits right on top of it. For a lot of organizations, this is the first time a full picture of a constituent is within reach.
Keep in mind that Data 360 is a platform decision with its own licensing and usage costs, and it works best when your data is in decent shape going in. Start with a clear use case and have the budget conversation early.
Where I’d start
If you’re a nonprofit on Salesforce and this sounds interesting, here’s the order I’d go in:
- Pick one question leadership asks every month and waits too long to get answered. Donor retention and program reach are good candidates.
- Agree on the definitions behind it, in writing, before anyone builds anything.
- Check where the data for that question lives and how clean it is.
- Build a small pilot with one semantic model, one dashboard, and the agent turned on for a handful of users. Watch what they ask and where the answers fall short.
Starting small keeps the cost and the risk manageable, and it gives you a real result to show your board before you commit further.
If you’re thinking about Tableau Next for your organization, or you’re studying for the exam yourself, I’d love to compare notes. Please reach out with any questions.
A short note on the exam
If you’re thinking about taking it, it’s 60 scored multiple-choice questions in 105 minutes, with 65% needed to pass. The largest section is Agentic Experiences at 25%, followed by Data Setup and Embedding, Cross-Cloud & Interoperability at 20% each.
Most questions are short scenarios that ask which approach fits best, so knowing when to choose one feature over another matters more than memorizing names. What helped me most was spending extra time on the Analytics Agent, since it’s the newest material, and getting comfortable with Data 360 first. Salesforce’s exam guide and Trailhead trail, linked below, are the place to start.